


Banking 101
What makes banks tick? How do we think about valuing banks?

How do Banks make Money?
There are two ways in which a bank generates revenue → net interest income (~65% of most banks) which is the product of making loans and investing in securities (the spread in interest rates is what the bank earns). The second way is fee revenue, this includes stuff like deposit service charges, capital markets/asset mgmt, mortgage and loan fees etc.
Interest rates are a key driver of business here as it drives borrowing costs, impacts loan demand, default rates and capital market activity. Banks are exposed to credit risk through the process of making and holding loans on their balance sheet, credit risk arises from other sources like holding securities or entering derivative contracts. Resultingly, risk management is incredibly important. Liquidity is even more important than access to credit for banks as some banks did have access to credit but failed to have the adequate liquidity to that caused a distressed sale.
The industry has also experienced several periods of meaningful changes since the early 1900s in terms of regulation. Generally speaking, bank stocks underperform when rates rise materially and outperform when rates decline sharply. Bank specific drivers, include net charge-offs, reserve build/bleed, NIM, security gains/losses and M&A.

NII — The dollar difference between the interest earned on a bank’s earnings assets (loans, securities and other interest earning investments) and the funding cost of a bank’s liabilities — deposits and borrowings. The drivers here are spread and volume.
NIM represents the spread/avg earning asset. NIM’s have historically risen because the sources of funding have become less concentrated while the borrowers have become more concentrated and a general shift towards higher yielding customers vs corporate loans. 1990s to 2008 NIMs declined because of increased loan competition. NIMs have increased from ‘08 to ‘11. (shown below)

There are four key reasons as to why some banks have higher NIMs than others:
Asset yields → loans typically have higher yields than securities and other short term assets. Loan mix could be geared towards higher yielding types (ex more exposure to credit card vs commercial).
Funding costs → Lower funding costs = higher NIM. Core deposits have lower costs than CDs or brokered deposits.
Capital levels → Banks with more equity capital have more funding which is non-interest bearing which means less to pay out which means higher NIM.
Other → Interest rate risk in bank’s securities portfolio, amount of competition in a specific market place.
This all being said, higher NIM isn’t necessarily better because a bank may be taking on more risk to generate this NIM.
Types of interest earning assets:
Loans → These are the largest type of asset on a balance sheet and are the greatest contributor of interest income. Banks prefer to make loans vs buy securities because loans offer more yield on a risk adjusted basis. The other side of this is that loans carry more credit risk and less liquidity. Loans typically represent 70% of interest income assets and 75% of interest income.
Types of Loans:
Real estate → Represent the largest loan category (50%+).
Closed-end residential real estate (~25% of total loans). These are loans that are for housing and don’t permit the borrower to borrow additional money without repaying the current mortgage and taking permission from the lender. Restricts the mortgager from refinancing. Can’t use collateral that has been pledged elsewhere. The result of his more secure loan is lower interest rates.
Revolving mortgages (10% of total loans). These are loans that have lines of credit that remain available even as you pay the balance. The borrower can pay the balance in full or make regular payments. These are also known as HELOCs. The house is used as collateral for the line of credit. As you repay your outstanding balance, the amount of available credit is replenished.
Commercial Real estate (~25% of total loans). Construction, land development, and loans secured by farmland. Multi-family residential properties and non-farm non-residential properties.
C&I (Commercial and Industrial) → Represent ~20% of total loans.
Consumer → Loans made to consumers that aren’t secured by real estate. These include credit cards, auto loans, student loans etc. Make up ~15% of total loans.
Other → (~5%) Loans for purchasing or carrying securities, agricultural production, govs, NBFIs.
Generally speaking, smaller banks have meaningfully higher exposure to CRE vs the largest banks. Whereas the largest banks have more exposure to home equity.
Securities → Banks hold securities as a source of liquidity, to help manage interest rate risk and as an earnings contributor (through interest income and realizing gains/losses through the sale of securities). Make up ~20% of a banks total assets. Over the past 30 years or so the security mix has shifted reflecting the preference for higher yielding securities.

Deposits → By comparing deposit rates to market interest rates we can get a better sense of how meaningful deposits are to bank profitability. The avg spread b/w deposits and the 2 year treasury yield is around 140bps. The deposit spread being negative doesn’t necessarily mean NIM is negative though. Historically, deposit repricing has averaged ~40% of the increase in the FFR. However, if rates increase, deposit repricing may be higher as customers may seek higher yielding products as rates rise and commercial deposit customers draw down on deposits to invest and grow.
Fee revenue (~35% of total revenue):
This has increased drastically over time which reflects the new fee structures and expansion into fee businesses (PWM, capital mkts, etc.). Fee income represents a larger portion of revenue at larger banks. Types of fee revenue are listed below:
Deposit service charges. Account for ~15% of noninterest income for mid sized to larger banks and ~27% of noninterest income for banks with less than $100mm in assets.
Non-sufficient funds and overdraft fees. Banks charge customers overdraft fees when they make a withdrawal/write checks when there are insufficient funds in the account to cover the transaction. Historically, NSF fees represent ~50% of deposit service charges. However, since regulation E, banks are now required to have customers opt-in to NSF/overdraft programs related to debit cards and ATMs.
Regulation: CARD Act in 2009 → Restricted banks’ ability to change interest rates and assess fees to reflect individual consumer risk; mandating standardized payment dates and prohibiting banks from allocating payments in ways that maximize interest charges and requiring banks to inform customers of any change in interest rates, fees or other terms of the card.
Expenses:
Noninterest expenses → Expenses that are unrelated to funding costs, basically opex, mostly wages, salaries and other employee benefits (~40% of noninterest expenses). Noninterest expenses also include net charge-offs Other items also include credit related costs like real estate costs related to foreclosed property, credit and collection costs, reserves for unfunded commitments, mortgage application fraud and mortgage insurance. The common theme here is that all of these expenses relate to some credit default.
Efficiency ratio → This tries to measure how efficiently a bank is managed. The ratio is noninterest expense (add back expenses associated with amortization and goodwill impairment divided by total revenue (net interest income + noninterest - securities gains and other one-time items).
The avg efficiency ratio for banks is slightly less than 65%. Efficiency ratios tend to decline as asset size increases. However, this stops after banks reach a certain size, once they get to mega banks they have higher efficiency ratios than smaller banks. However, this could also be due to a higher mix in capital market rev etc.
Another interesting metric is OREO expenses. OREO stands for Other real estate owned. This is property that is acquired through foreclosure or other legal proceedings. Any gains or losses upon disposal or write-downs subsequent to repossession are classified as OREO expenses. Some banks hold OREO for up to 5 years, but can hold it to longer than that given the blessing of the government.
What’s the Impact of Interest Rates on Banks?
NIM:
Interest rates are generally derived from the market interest rate. Lower interest rates reduce financing burdens for consumers and lower hurdle rates for commercial borrowers. While interest rates are a driver of the amount of mortgage activity there is, there are other drivers like consumer sentiment and underwriting standards that are massive factors as well. Declines in long-term rates also lead to spikes in refinancing activities. There is a weak correlation between short term rates and deposit activity. Short-term savings deposits, money market deposits, and fed funds are very interest-rate sensitive, while other deposits (demand deposits and NOW accounts). CDs are fixed rate but reprice when they mature to reflect the current rates environment. Changes in deposit pricing typically lag the 3 month T-bill by 6-9 months. NIMs rise when rates rise because of higher yields (mainly because of the steep yield curve), 3 month T-bills and NIMs are highly correlated. The steepness of the yield curve is an important consideration when thinking about NIMs, steep = increasing NIM.
With regards to securities, when loan demand is weak (during a time of high rates), a bank could buy securities to benefit off of the high interest income, the bank may incur losses from the sale of the securities though. In a falling rate environment, a bank could hold onto its fixed income securities to benefit off of the price increase. If management expects rates to rise they would want to be more asset sensitive (or less liability sensitive). For instance, if it expected rates to rise they could sell their long term securities and buy short-term securities. Thus, interest rate expectations are key driver of securities positioning.
Credit Costs:
Industry net charge-off rates had a moderate to strong correlation to the 10 year rate. This is logical as the higher the interest paid the higher the chance of a default. However, if a bank has more exposure to fixed rate loans, a drop in rates may increase defaults since borrowers who cannot refi would rather not make payments when lower rates are available and purposefully default. So it depends on the mix of variable rate to fixed rate.
Interest Rate Sensitivity:
A bank’s interest rate sensitivity is characterized by how quickly its assets re-price relative to how quickly its liabilities reprice given a change in interest rates. Given that yield curves have historically sloped up and a secular decline in interest rates they have been liability sensitive (this is logical).
It’s hard to know how interest rate sensitive a bank truly is because their disclosures represent one point in time which can be misleading because of banks’ continuous rebalancing of assets and liabilities and also because sensitivities could be managed towards the end of the quarter. Most disclosures only highlight the impact to net interest income and not to the balance sheet (unrealized security losses). Given the host of unknown assumptions that make bank by bank comparisons more difficult, it’s somewhat of a pointless exercise to compare these banks.
Yield Curve:
In a situation where the yield curve is inverted and there is weak loan demand, the banks will carry on with the carry trade (borrowing at low rates and lending out at high rates). They would also try to add fixed rate assets or become more liability sensitive to further profit.
Interesting historical case study on the carry trade:
The crisis essentially started after then Fed chairman Paul Volcker decided in October 1979 to restrict money supply growth, causing interest rates to spike. Short-term rates rose more than 6% between June 1979 and March 1980 (from 9.1% to 15.2%). Deposit costs rose meaningfully, while banks were stuck with longer-term fixed rate assets. For example, the interest rate spread between mortgage portfolios and average funding costs was -1% in 1981 and -0.7% in 1982. Furthermore, as rates spiked, prices declined for securities held by the banks, which resulted in large losses. From 1981 to 1982 alone, the S&L industry collectively lost nearly $9b and eventually lost $160b, with over 700 savings and loans failing.
Predicting the spread of the yield curve is immensely important when banks think about carry trade strategies. A very interesting stat is that the correlation of the proportion of securities as interest earning assets in a bank’s portfolio to yield spread was highest 9-10 months following periods of rapid interest rate changes. Also even if the yield curve is inverted, carry trades are possible because there is a lag in deposit rates and they aren’t 100% elastic as well. Overall though, there is a strong correlation between the security deposit spread and the yield spread.

Impact on Earnings:
Even if NIM is graphed with a lag, the correlation b/w spread and NIM is weak. This correlation has been weakening since the 1980s, the reason being that banks have diversified into non interest revenue streams. Generally speaking though, a flattening yield curve leads to some earnings pressure given lower re-investment rates (the interest that can be earned when money is taken out of one security and used to buy another). The corollary that a steeper yield curve is better for earnings is also true.
Impact on the Balance Sheet:
One would expect banks to hold more mortgages as yield curves steepen, however mortgage exposure appears to have been stable over the past decade across various yield curve scenarios. Deposit costs obviously rise when the yield curve flattens. However, if the yield curve flattens because rates fall on the long end the bank must lower deposit costs to maintain spreads. When they say deposit rates lag that also means that as the spread decreases, it’s followed by a period of decreasing deposit costs such that the bank can increase the securities deposit spread. When the yield curve flattens the net charge off rates increase as a flattening yield curve is a sign of a weakening economy which leads to more delinquencies. The opposite is also true.
ALM:
Asset liability management refers to the management of funds on and off the balance sheet to best suit the interest rate and liquidity scenario at the time. This includes buying/selling securities, loan approval, funding decisions. ALM aims to manage the dollar/maturity gap → the difference between the dollar amount of rate sensitive assets and liabilities. If the gap is positive net interest income will rise if rates rise and vice versa.

It is to be noted, however, that aggressive gap management can be harmful as if rates rise, longer duration assets would decline more in dollar value than shorter duration assets if rates were to rise and these assets were sold (leading to losses). If a bank increased its liability sensitivity that would also mean that they’d be due in a shorter period of time which could constrain funding. Sophisticated banks use financial derivatives to hedge rate risk.
ALM response to rising rates: Sell LT securities to buy ST (bc short term are variable rate and thus their price won’t fall as much and their coupons will also increase), make more variable rate loans, selling longer-term CDs
ALM response to falling rates: Lengthen the duration of fixed rate assets and reduce variable interest rate loans, shorten the maturity of its liabilities.
There are two approaches to dealing with interest rate risk: on balance sheet strategies (loans, deposits and securities) and off balance sheet strategies (interest rate swaps, futures and forward contracts).
On balance sheet:
Changing asset/liability sensitivities, adjusting maturity schedules.
Securitizing assets and selling them to investors.
Buying tranches of securitized loans or participating in large loans.
Off balance sheet:
If a bank is receiving fixed rate payments but reckons rates will increase it can enter into a swap agreement with another party who is paying variable rates.
Capital and Regulations
Capital (common, preferred equity and hybrid securities) is the portion of a bank’s balance sheet that is available to protect depositors, customers and counterparties from losses. The forms of non-common capital are shown below:
Trust preferred: Securities issued by a trust which is formed by a bank. Proceeds from the sale of these securities are used to purchase the subordinated debt of the bank. Interest from the purchase of these securities is used to pay dividends on these preferreds. Most of these were phased out in 2015 and aren’t considered tier 1 capital.
Hybrids: Like TruPS but the debt purchased is more subordinated and the interest can be deferred. Hybrids have a contract to purchase non-cumulative perpetual preferred stock 5 years in the future. Before this though, the trust resells the subordinates securities it owns to new investors and uses it to buy these preferreds.
Cumulative preffered: Stock which pays a fixed dividend, unpaid dividends accrue.
Non-Cumulative preffered: Same as before but dividends don’t accrue, to count as tier one capital the shares must be perpetual or long-termed.
Convertible preferred stock: Fixed income securities that give the holder the option to convert into common stock.
The strength of capital is determined by how available it is to absorb losses and how far away it is in terms of claims during bankruptcy, think of it as punching bag capital. Moreover, securities that don’t recieve contractually obligated dividends are typically stronger forms of capital.
The role of capital in a bank is multifold:
Sources of funding: Used to expand operations through acquisitions, originations and capex.
Absorb unexpected losses: Capital is net of loan loss reserves. Any losses exceeding what the bank has estimated will reduce capital, therefore the greater the magnitude of this capital the lower the probability of insolvency.
Increased capital requirements reduce ROE at the same time though.
There are certain key capital metrics that serve to regulate the proportion of capital held.
Tier 1 Capital ratio: Tier 1 capital/risk-weighted assets. Tier 1 capital = common equity + perpetual non-cumulative preferred stock + cumulative preferred stock + minority interest - most intangibles - AOCI - investments in non-financial companies.
Tier 2 Capital ratio: Tier 1 capital + allowance for loan losses, subordinated debt and capital not included in tier 1 capital divided by risk-weighted assets.
Total risk-based capital ratio: Tier 1 + Tier 2 divided by risk-weighted assets.
Tier 1 common ratio: Tier 1 ex qualifying perpetual stock, minority interest, TruPS divided by total risk controlling assets
Leverage Ratio: Tier 1 capital/avg adjusted assets. avg adjusted assets = avg assets less goodwill and intangibles. Doesn’t risk weight assets.
TCE (Tangible Common Equity): Equity less goodwill and core deposit intangibles divided by tangible assets. This includes unrealized gains and losses on securities and swaps.
Under Basel I, banks should have Tier 1 ratios of >4% and total cap ratios of >8%. This, however, is probably higher for systematically important banks.

The risk weighting of securities and loans is described below:

GAAP metrics and regulatory metrics of capital differ in a few ways. (TCE vs cap ratios):
DTAs that look like they will be used within 20 years can be included in TCE. For Tier 1 capital DTAs that will be used within 1 year are recogniszed.
OCI refers to the unrealized gains and losses on available for sale securities, derivatives, forex hedges and pension liability adjustments. Under Basel III, negative OCI is included but positive isn’t.
TCE doesn’t include TruPS.
Factors that impact Capital ratios:
Profitability → Positive net income = increase in cap ratios, however if RWAs increase significantly faster than its capital then it will decrease.
Change in RWAs → Selling assets with higher risk weightings decreases RWA and this increases cap ratios.
Return to shareholders → Dividends and Buybacks reduce capital
Capital Conversion → Converting preferreds and debt to common capital increases the ratios.
When comparing one bank’s capital ratios with the other there are a few factors that we need to consider:
Earnings power: Future profitability = future capital so banks with more favorable earnings expectations may be able to operate with lower capital levels without raising concern. Low capital levels could point to future dilution.
Loan loss reserves: If we have two banks that are equal operationally and one of them allows for greater expected loan losses (taking away from capital), the bank that isn’t doing this is likely overstating the capital that they have and in the LR the banks capital ratios will have to be equal.
Credit
Credit risk is the risk that a bank will not be repaid in full (principal and interest) by borrowers and/or counterparties.

The ways to measure bank credit risk include net charge-offs as a % of loans, NPLs as a % of loans, NPAs as a % of total assets, loan loss provision as a % of net charge-offs
Net charge-offs: A bank takes a charge-off when the loan is deemed uncollectible. the portion of the loan that is deemed to be uncollectible is charged of. The loan is charged off to its net realizable value.
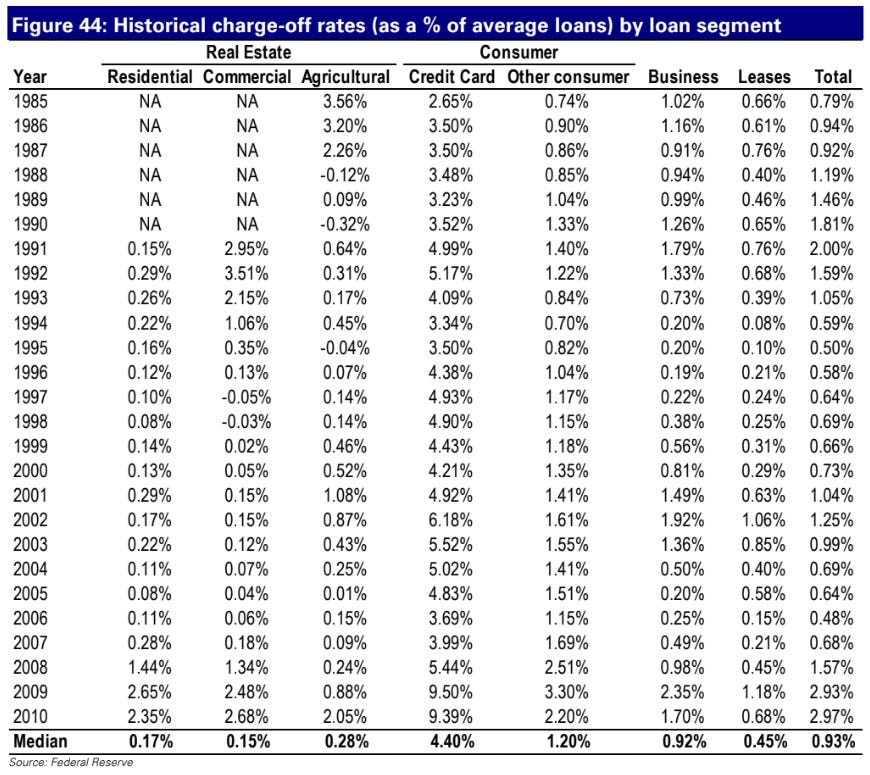
NCO/avg loans: Measures the % of loans (not the nominal amount of loans but the actual proportion of the charge-off of individual loans) that on average that are charged off in a given time period. There is a wide range of loss rates for different loan types. Residential real-estate is typically low (15-20 bps). Credit loans have consistently had higher loss rates which reflect the fact that they are unsecured.

NPLs: When a loan is past 90 days due, a bank will classify it as a nonperforming unless it is well secured and in the collection process. When a loan is placed on nonaccrual status the bank stops accruing interest on the loan (expected default). Any interest that has been accrued but not collected is charged against the bank’s loan loss reserve.
NPLs/loans: Most NPLs lead to charge-offs, this is a leading indicator of potential future credit losses. It’s hard to compare b/w banks because different types of loans have different loss content and some may be collateralized.
NPAs/total assets: Similar to before helps gauge potential future credit losses. modified NPA also includes troubled bank restructurings which are loans to distressed borrowers whose terms have been modified.
TDR: Banks will restructure a loan to minimize loss caused by default. Restructuring is considered troubled if a bank grants a concession that it wouldn’t have considered otherwise due to the borrower’s troubled financial situation. May include: reduction in interest/extension of maturity, reduction of interest or accrued interest, seizing of collateral, issuance of equity to the bank.
Loan loss provision expense: This is an IS item that adds to the loan loss reserves. When a bank takes a charge-off on a loan that has already been accounted for by this line item. When this provision is greater than net-charge offs it effectively adds to loan loss reserves.
Allowance for loan losses: This represents mgmt’s estimate of probably or expected credit losses inherent in a held to maturity loan portfolio. LLR is a contra asset to gross loans. LLR estimation methodologies are pro-cyclical meaning that they require banks to increase provisions during the point in the credit cycle when it is most difficult to do so. This magnifies the financial impact of a credit-down cycle. The corollary is also true in that during periods of low credit losses banks reserve less for credit losses.
Reserves/loans and reserves/net charge-offs: all else equal, a bank with a higher reserve/loan ratio will be better able to absorb future credit losses.
Reserves/NPLs: This metric has been systemically decreasing which means that the nonperforming loan balances have been increasing faster than banks have been adding to reserves.
Unsecured consumer loans are charged-off when they’re 120 days past due, secured consumer loans after 120 or 180 days and commercial/CRE loans after 90 days.
Liquidity
Liquidity is defined as the ability of a bank to fund cash demands at a reasonable cost, cash demand typically include deposit withdrawals or new loan demand. The mechanism through which banks make money, the carry trade, inherently exposes them to liquidity risks.
Assets that can be held as sources of liquidity: secondary reserves which include T-bills, federal funds sold, reverse repos, deposits places with correspondent banks, negotiable CDs and government backed securities.
Liabilities for this same purpose include federal funds purchased, repurchase agreements, jumbo CDs, FHLB borrowings and fed discount window borrowings.
It is this combination of asset liquidity management (having a sufficient amount of liquid assets on its balance sheet) and liability liquidity management (having access to external funds through borrowing) that is important.
LLM:
LLM generally has an advantage in that it can produce a higher return for banks. This is because it enables banks to shift their asset bases from low yielding, short-term money market instruments to LT, higher yielding loans/securities. Moreover, carrying low yielding, liquid assets on the balance sheet in case of a liquidity need has a lot of opportunity cost to it, rather have a more flexible source of capital that one can access through simply increasing/decreasing the rate offered on new borrowings.
Yet it is riskier as the bank is taking on more debt and is faced with greater interest rate risk and a greater credit risk (more leveraged in this case as an enterprise hence more risky), moreover when they need liquidity the most is when it’s most expensive.
Summary of the key idea with LLM: While liability liquidity management offers a number of advantages to banks in a normal operating environment (primarily in the form of higher ROAs), its primary downfall is its lack of dependency in a stressed situation (either macro driven or bank specific). Under such a scenario, a bank would likely need to depend on asset liquidity given its ability to borrow may be impaired. For this reason, having an ample amount of asset liquidity is important for public confidence and can be viewed as a type of liquidity reserve.
What’s the impact of high interest rates on liquidity management?
Higher rates = higher borrowing costs
Higher rates = reduces the value of assets banks are selling for cash
Higher rates = deposit drain because:
deposit withdrawals may pick up as depositors look for better returns elsewhere
customers with existing commitments to borrow may back out as they seek times of lower rates
At the same time though higher asset liquidity levels pressure bank NIM, near term = lower yielding.
How banks estimate liquidity needs:
Sources and uses of fund method → forecast of loan and deposit trends to estimate whether a bank will have a liquidity excess or shortfall. The liquidity will be invested and the shortfall will have to be cancelled out by raising funds.
Structure of funds method → Groups funding sources based on the likelihood of them being withdrawn. The banks then decide on an appropriate liquidity reserve for each category. The bank must also have liquidity reserves for any new loan demand.
Market indicators → Takes into account a number of market indicators that point to liquidity issues: poor stock performance, widening credit spreads, pickup in Fed discount borrowing window, bank incurring losses on the sale of assets (to meet liquidity needs), creditors withdrawing money.
Liquidity ratios → Need to look at all of them in conjunction
Cash ratio → (cash and due from banks/total assets).
Net federal funds and repo agreements ratio →((Fed funds sold + reverse repos) - (fed funds purchased + repos)/total assets). This shows whether a bank is a net lender or borrower inthe short term market relative to the size of the institution.
Liquid securities ratio → (US gov securities/total assets). Assesses the proportion of assets that are very liquid.
Pledged securities/total securities → pledged securities are those securities that re pledged most commonly as collateral for deposits/borrowings and/or derivatives. They can’t be counted on as a source of liquidity.
Loans and leases/total assets → Loans and leases are usually the most illiquid bank assets and thus the greater the proportion of them the less liquid the bank is.
Loans/deposits → Shows how much of a bank’s loan portfolio is funded by deposits (which are a more stable source of funding than borrowing). The inverse of this ratio also exists with the loans/non-deposit liabilities ratio.
Unused loan commitments/total assets → Unused loan commitments represent a commitment by the bank to lend (a liquidity outflow) the greater the ratio the greater the banks liquidity needs will be.
Small denomination deposits/total assets → Since deposits > 250k aren’t FDIC insured they’re more likely to be withdrawn in times of crisis. So the greater the ratio the better liquidity position.
Demand deposits/time deposits → Demand deposits = can be withdrawn at any time, time deposits = fixed maturities. Lower the better liquidity position.
Brokered deposits/total deposits → Brokered deposits are the least stable type of deposits since they’re only deposited based on yield so they’re the first to go.
Short-term assets/volatile liabilities → This ratio measures how much of a
bank’s most unstable funding sources can be covered by its most liquid assets. The greater this ratio is, the better liquidity position a bank has.
These ratios have been declining over the past few decades, particularly asset liquidity ratios because banks have better access to sources of liquidity, deposit mix shift towards longer maturity deposit, decline in reserve ratio requirement, and a more stable economic outlook.
According to Basel, the liquidity coverage ratio (LCR) identifies the amount of high quality liquid assets that an institution holds that can be converted into cash to meet its liquidity needs for a 30 day time horizon under an acute liquidity stress scenario. A bank would need to hold liquid assets that were at least equal to the estimated net cash outflows in such a scenario. The stress scenario incorporates situations like a downgrade in credit rating, bank run, loss of secured wholesale funding capacity, market price volatility impacting quality of collateral or potential future exposures, etc.
Narrowly speaking, a high quality, liquid asset is cash, central bank reserves and government debt. A broader definition would include high quality corporate bonds. Though the value of these bonds would recieve a substantial haircut and the portfolio would have to be diversified.
To calculate the outflow of funds in a stressed scenario there are a couple of important considerations:
Retail deposits: Stable retail deposits would have at least a 7.5% run-off factor while less stable retail deposits would have at least a 15% run-off factor. Less stable deposits include deposits that aren’t covered by deposit insurance, high value deposits, foreign currency deposits etc.
Unsecured wholesale funding: Unsecured wholesale funding provided by small business customers would have a 7.5%, 15% or higher run-off factor. Unsecured wholesale funding provided by non-financial corporate customers, sovereigns, central banks and public sector entities that are held for operational purposes assume a 25% run-off factor.

The Net Stable Funding (NSF) ratio measures the amount of a bank’s longer-term, stable sources of funding relative to the liquidity profile of its assets. Under this liquidity standard a bank would be required to have available stable funding (ASF) that is greater than its required funding over a one year time horizon.

Assets that aren’t completely stable are multiplied by an ASF factor to account for their lack of stability.
RSF is determined by summing the value of a bank’s assets multiplied with the asset’s RSF factor. The RSF factor is the amount of stable funding that the asset needs. Thus the more liquid an asset is the lower the RSF factor.
Bank Regulations
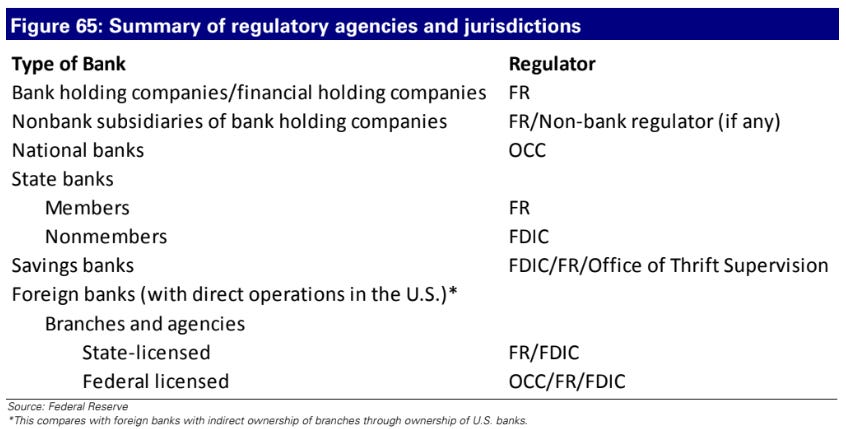
Generally speaking, banks are regulated to reduce the risk of widespread bank failure and to protect depositors. The three main regulators are the Federal Reserve System, the FDIC, and the Office of the Comptroller of Currency.
Fed: Conducts monetary policy, maintaining stability in the financial system, provide financial services to the gov and financial institutions, supervising and regulating bank institutions.
FDIC: Acquires and disposes of failed banks by selling their deposits to other institutions. The FDIC is the primary regulator for state banks that decide not to become members of the FRS. Dodd-Frank ensures that the covered deposit limit is 250k.
All insured depositories will pay FDIC deposit insurance premiums depending on the size of their entire funding base. The way paying premiums works now is that it is based on the risk of the bank and the size of the bank and whether it’s a highly complex financial institution. The change here is taking into consideration the size of the bank and whether it is a highly complex financial institution.
OCC: Supervises all national banks in the US and supervise the federal branches of foreign banks. Also approves new charters. Takes supervisory actions against banks that don’t comply with laws or that have unsound banking practices.
CAMELS:
Capital Adequacy: Based on quality of assets, loan loss reserve levels, access to capital markets and adherence to regulatory capital requirements.
Asset Quality: Based on the amount of nonperforming, delinquent and restructured loans.
Management: Performance of management in terms of monitoring bank activities, history of responding to risks and maintenance of other CAMELS ratings.
Earnings: Profitability margins, adequacy of budgeting process, earnings exposure to market risks and other factors.
Liquidity: Ability to meet near-term performance obligations, maturity schedules, diversification of funding resources
Sensitivity to market risks: Earnings exposure to changes in interest rates and foreign exchange and ability of management to deal with this.
Securitization
Securitizations play the role of supplying funds for all types of loans including auto, credit card, corporate loans and mortgage through the creation of asset backed securities. Before securitizations most loans remained on a bank’s balance sheet, this limits the supply of credit for borrowers. The large picture idea with MBSs is we’re making an illiquid asset liquid through securitization and if properly constructed all parties should benefit. Borrowers benefit by getting mortgages at more attractive rates, banks earn fees and investors earn yields.
What is an MBS?
The MBS is the most common type of securitization, it is an ABS that has a claim on the cash flows of pools of mortgages. The mortgages can be residential or commercial. Mortgage risk is greatly reduced by packaging mortgages into these securities, the inherent risks associated with the underlying mortgages (pre-payment and extension risk) remain. These risks kept many investors out of the mortgage market until the creation of collateralized mortgage obligations. Under the CMO (CDO) structure, mortgages are packaged into pools which are then broken down into tranches (based on repayment priority). This derivative made it a lot more appealing to investors as it appealed to a wider range of investors
A SPE is how the pool of mortgages becomes securitized. The ownership of the mortgages is transferred from the investment bank to the SPE. This removes the loans from the originator’s balance sheet and no longer at risk should the originator declare bankruptcy. Other important players in this structure are:
Sponsors: Investment banks provide the structuring and model the cash flows of these MBSs
Ratings Agencies: Issue ratings on the MBSs
Trustee: Responsible for protecting the interests of the investors in the newly formed securitization. Also responsible for appointing a servicer to service the pool of mortgages and allocate cash flows to shareholders of the SPE.
Underwriter (IB): The underwriter is responsible for marketing and distributing securities to investors.
Following the GFC, Dodd-Frank calls for originators of securitizations to hold 5% of each security, without hedging, to ensure they have vested interest in their success, this reduces the blatant moral hazard that led to the GFC. A lot of other assets have been securitized like student loans, automobiles, credit cards, etc.
Valuation
Any firm that provides financial products and services to individuals or other firms can be categorized as a financial service firm. A bank makes money on the spread between the interest it pays to those from whom it raises funds and the interest it charges those who borrow from it, and from other services it offers it depositors and its lenders. The problem when it comes to valuing FIG in general is that cash flows to a financial service firm can’t be estimated because capital expenditures, working capital and debt aren’t clearly defined. The second is that FIG operates under a regulatory framework that governs how they are capitalized, where they invest and how fast they can grow.
For financial service firms debt is a source of raw material and reinvestment is a weird concept for a bank. They are also heavily regulated and changes in this regulatory environment can have a significant impact on value. Accounting for banks is also very different to normal institutions.
The accounting rules used to measure earnings and record book value are different for financial service firms than the rest of the market, for two reasons. The first is that the assets of financial service firms tend to be financial instruments (bonds and securitized obligations) that often have an active market place. Thus we can mark assets to market. The nature of operations for financial service firms is such that long periods of profitability are interspersed with periods of losses. The differences in accounting rules include:
Mark to Market: As a result of mark-to-market being used to value assets in FIG and it not being used in non FIG, one can’t compare the book value ratios of FIG and non-FIG → it’s just not meaningful. Moreover, the meaning of ratios computed is non-comparable for financial service firms as well. ROE for non-financial service firms is a measure of the return on equity invested originally in assets. Book equity for FIG, on the other hand, is an updated market value of the equity in a financial institution.
Loss provisions and smoothed out earnings: Banks have provision for losses as items on their balance sheet, these provisions for losses intend to average out losses over time and charge the amount against earnings every year. Though this practice is logical, there is a catch, insofar as the bank is given the responsibility of making the loan loss assessment. A conservative bank will set aside more for loan losses, given a loan portfolio, than a more aggressive bank, and this will lead to the latter reporting higher profits during good times.
Debt and Equity
‘In other words, debt is to a bank what steel is to a manufacturing company, something to be molded into other products which can then be sold at a higher price and yield a profit.’
If we considered the interest paid to depositors as debt then the operating profit for a bank wouldn’t be representative of the entities true operating profitability as the main expense here is the interest paid on these deposits. That expense in my eyes is necessary for a bank to conduct its normal operations therefore it should be considered an operating expense.
Capital Expenditures and Working Capital:
Unlike manufacturing firms that invest in plant, equipment and other fixed assets, financial service firms invest primarily in intangible assets such as brand name and human capital. Consequently, their investments for future growth often are categorized as operating expenses in accounting statements. Not surprisingly, the statement of cash flows to a bank show little or no capital expenditures and correspondingly low depreciation. With working capital, we run into a different problem. If we define working capital as the difference between current assets and current liabilities, a large proportion of a bank’s balance sheet would fall into one or the other of these categories. Changes in this number can be both large and volatile and may have no relationship to reinvestment for future growth.
Given these considerations, what do we use if not cash flow?
Earnings: There are analysts who value banks by discounting their earnings back to the present. They make the argument that the banks have little or no net capital expenditure needs and that working capital needs are non existent. The issue here is that they grow earnings at a high rate. If a bank pays out 100% of its earnings as dividends, if the firm issues no new equity (no net capex) then the bank will fall below cap requirements. Re-investment has to include investments in regulatory capital, acquisitions and other such investments that banks need to make to continue to grow. This is why mature banks with even low growth rates can’t afford to have a 100% dividend payout ratio.
Dividends: If we use a dividend discount model we’re implicitly assuming that the dividend that is paid is sustainable and reasonable. However, some banks may pay out less dividends than they potentially could and use the excess cash to pad their cap ratios. Another bank may pay dividends that are far too high and then issue new shares as a source of capital. If we use current dividends paid as a way to value these banks we will undervalue conservative banks and overvalue aggressive banks.
The focus on current dividends creates problems when analyzing banks that have growth potential. If these banks hold back on paying dividends there may be no dividends. Not adjusting the dividend payout ratio will lead to us undervaluing these banks.
Trusting book value: Assets may be marked to market, but that does not remove the need to assess their value independently. No better example of this being necessary exists than the 2008 financial crisis. The book value of MBSs reflected the market prices of these securities at the time. Only when the market collapsed did we realize that the book value of financial service firms overstates their true values. Second, in many cases, assets are marked to market, based not upon an observable market price, but upon models used by the appraiser; in fact, the firm that holds the securities often assesses their value for accounting purposes. Not surprisingly, there is a tendency to overstate values and a lag in recognizing changes in those values.
Generally speaking, we know far less about the assets of financial service firms than we’d like to because they’re regulated. We assume that the regulatory authorities will keep banks and insurance companies in check and ensure that they don’t over reach in their risk taking. When analysts compare the price earnings ratios of banks, for instance, and do not control for the risk of the loan portfolios of these banks, they are assuming that all banks are equally risky. Not surprisingly, riskier banks will look cheaper in this comparison.
DDM:
The DDM values a stock on the basis of the present value of the expected dividends on that stock. Assuming that the equity in a company has an infinite life, the dividend discount model can be summarized as follows:

Where DPS = Expected dividend per share in period t, k = cost of equity. If we assume that the expected growth rate in dividends is constant forever, this model collapses into the Gordon Growth model.

Where g is the expected growth rate in perpetuity and DPS1 is the expected dividends per share next year. The inputs that drive the dividend discount model are the cost of equity that we use, the proportion of the earnings that we assume will be paid out in dividends and the expected growth rate in dividends over time.
COE:
The cost of equity for a financial service firm, like all other firms is the risk in the equity that cannot be diversified away by the marginal investor in the stock. When calculating the cost of equity we should use bottom up betas that are unlevered. The reason for this is because it’s a somewhat pointless exercise to adjust for relative risk due to leverage because financial service firms tend to be much more homogenous in terms of capital structure and have similar financial leverage due to regulation. That and debt is difficult to measure for financial service firms.
Growth and Payout:
There is an inherent balance between dividends and growth. When a company pays a larger part of its earnings as dividends as compared to redeploying that capital into loans, securities or increasing capital to allow for expansion of assets it is in a large way limiting its growth prospects, and should thus grow more slowly. When a company is paying out more in dividends, it is retaining less in earnings, the book value of equity increases by the retained earnings. Moreover, banks may return cash to shareholders through buybacks, thus only thinking about dividends doesn’t encapsulate the true returns shareholders benefit from. The fix to this is obvious but unlike dividends, buybacks vary significantly in volume YoY compared to dividends.
When thinking about a measure of how well retained equity is reinvested, ROE is the variable we’re looking for. As a result, expected growth in earnings = Return on equity*(1-Dividend payout ratio). This is the key variable that really ties everything else together. The return on equity, with expected growth rates can be used to estimate dividends. When we get to stable growth, the payout ratio becomes 1 - g/ROE(stable) This is just a variation on the equation mentioned above. Applying these numbers to the value of equity in stable growth yields the equity value accordingly.
Excess Returns Model:
This approach to valuing financial service firms approaches valuation through summing up the capital invested currently in the firm and the present value of the excess returns that the firm expects to make in the future. A firm that invests its equity and earns the fair market return no these investments should see the market value of its equity converge on the equity capital currently invested in it. The same logic can be applied to if the return on this invested equity is below or above market return.
The two main inputs needed to value equity in this way is a measure of equity capital currently invested in the firm. The second is the expected excess returns to equity investors in the future. The first part of the equation, the equity capital currently invested in the firm, is usually measured as the book value of equity in the firm. However, there are cases where the book value of equity can be affected by the stock buybacks and extraordinary one time charges. In such a case the book value of equity understates the equity capital invested in a business. The excess returns, can be stated in terms of the ROE and COE. Excess Equity return = (ROE -COE)(Equity capital invested). Analyzing the ROE of the firm going forward requires an analysis of the firm’s strengths and weaknesses as well as the competition faced by the firm. The math for GS as per Damodaran, assuming an ROE of 9% compared to a COE of 12% is shown below.

Net income each year is computed by multiplying the return on equity each year by the beginning book value of equity. The book value of equity each year is augmented by the retained earnings. To close the valuation we have to find a terminal value for the value the firm may create after the explicit projection period. Assuming that the net income would grow 3% a year and that the beta for the stock would be 1.2. ROE is set to be the COE in stable growth. Net income in year 6 = Book value of equity at the start of year 6 * stable ROE. The terminal value of excess returns on equity is shown below.

To find the total value of equity then add the terminal value of excess returns, the current book value and the pv of excess equity return in the projected period.
I understand that this is a rather lengthy post, thank you for reading!